Having just got back from a holiday in Switzerland (which was awesome) we got home to a slightly chilly house, and so turned the heating back on. Although I’ve not posted here for a while, work has continued over on the Github repository for Boiler.io and there are a few new features that I’ve added that are worth mentioning. I’ve also replaced the crusty jQuery-based UI with a nice React application. It’d be great to hear from you if you’re interested in running open source heating software.
Why am I doing this? Firstly, it’s a great learning exercise as my software engineering background has largely been in the world of operating systems, completely different than this kind of web/IoT application. I hope it will be more than a toy though: as we become more and more conscious of the environment I think it’s increasingly important for technologies that help to save energy to be as open and accessible to everyone, so from enabling people to turn off their heating when not at home, through to making algorithm improvements to make boilerio more efficient will help all its users as well as provide a reference for others implementing similar systems.
Links to the software
New features
Multiple zones

As we have two floors in our house I wanted to control them independently. In the first year of running boilerio, I only controlled the ground floor heating and used our existing system for the first floor. Since implementing support for two zones, I controlled both floors of our house with no major issues for the whole of last winter.
Much of the changes were fairly mechanistic; one key decision was how to change the schedule representation. The minimum to get this working would be to have two instances of the controller running with separate databases, etc. A step up could have been to have two clients running against a single server with the schedules represented separately; this is probably a classic microservices design. One disadvantage would be that it’s harder to co-ordinate between the clients for features like timing the on/off cycles of the multiple zones to be out of phase to reduce load on the boiler.
In the end I added zone IDs to entries in the schedule table that refers back to a new “zones” table where that zone is given a name and the temperature sensor ID that it uses. This implies a 1:1 relationship between control zones and sensors, which could easily be improved upon in future. The existing
/schedule endpoint is now basically unused (though was updated to return a mapping of zones to their schedule) and instead there’s a per-zone
zone/<id>/schedule endpoint.
Time to temperature

I wanted a similar feature to Nest whereby the heating is turned on before the requested time in order to reach the desired temperature by the requested time. The starting point for this has been to add predictions that are shown in the UI as to how long it will take to get to the current target.
The current implementation was good to learn from but probably needs to be changed. There is a separate program,
monitor, that looks at what the boiler and sensors are doing and at the weather report (to determine the different between the inside and outside temperatures) and tries to determine the rate of heating. It watches for periods where: (i) the heating has been on for at least ten minutes; (ii) after the first ten minute period that is ignored, it’s been on for a further continuous ten minutes and the temperature rose during that time. We then take the duration of the interval and the starting and ending temperature to determine the rate of heating given the difference between the inside and outside temperature at the start of the period. This published to the server. The REST API then exposes a
gradients API on the zone where the client can retrieve an aggregated view of the heating gradient for a given temperature delta (currently this gives the mean gradient for readings rounded to the nearest half degree Celsius). The client can then use this information to predict a time given the current and target temperatures.
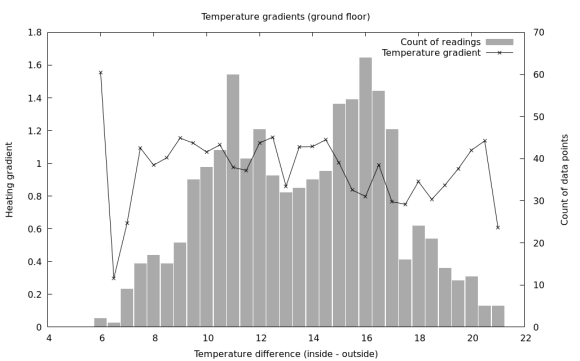
Was it worth it? The graph above shows a visual representation after running the system with measurements being recorded over one winter. The line is the temperature gradient at a particular temperature difference, and the bar shows how many readings went into that aggregate value (so you can see we can probably safely ignore the outermost data points as not having enough input data). I think it’s not totally clear; the definitely does seem to be a downward trend in the heating rate as the temperature difference increases, but there’s also some upward spikes including at the highest temperature differences. However, there are several confounding factors:
- The boiler temperature could have been changed as the outside temperature changed, which would affect the rate of heating but isn’t observable by this method.
- The downstairs temperature sensors is in the kitchen, so can be affected by cooking being done at the same time as the heating is on. Again, this isn’t currently observable by the system, although real-time energy use data for the house is available so could potentially help here.
- Similarly, doors being open or closed can make a big difference, as can room occupancy. These are awkward to measure and account for.
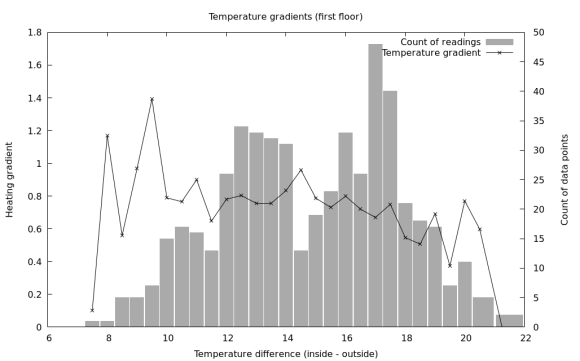
For comparison, here’s the same graph for the first floor, which isn’t affected by the “cooker effect”:
Although I knew it going into implementing this gradients API, a better (if more time consuming to implement) method would be to actually record the time-series data for temperature and boiler on/off over time. This way, it would be possibly to try out different algorithms on historical data, and also the logic as to what data to record would be moved off the client. Luckily this is also quite a neat UI feature too, so is appealing as a next step for development.
Cleaning up the API
As the REST API was starting to get a bit bigger and was basically undocumented, I was starting to find it difficult to keep it in my head and thought it was time to document it. In doing so, I’ve started to move it over to
flask-restplus, where one of the advantages is that it gets Swagger documentation and UI automatically.
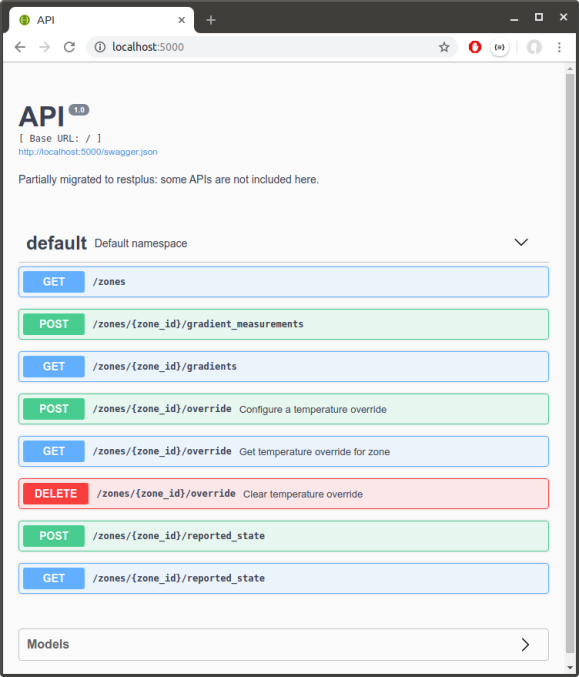
One of the annoying things about this is that it doesn’t work well when hosted on a proxy server not at the root. There’s a few threads about this issue online but no pleasant solution that I’ve found: I don’t want to have to modify the application to know its actual root, and I don’t want to modify the proxy configuration to know the app uses Swagger ideally (maybe that’s the better option). I think there’s still room for someone to figure out a good solution here.
There’s still work to do; I moved some of the
zones APIs to
flask-restplus and tried to clean them up along the way, but there are still improvements that could be made: e.g. the
schedule API could be moved under
zones since it lists out each zone separately anyway (and could probably do with some thought applying as to how to make it more RESTful and single-purpose — seeing
target_override in there for example is somewhat cringe-worthy.
Conclusion
There’s still a lot of exciting avenues to explore: keeping a temperature history that can also be used to do machine learning for the temperature prediction, modifying the scheduler to start the heating early according to the prediction, integration with other home automation tools, and a lot more. However, having used Boiler.io for two winters now, I’m really pleased with the stability and usability as it currently stands. It’d also be great to enable other physical devices to work with it (e.g. some of the Z-Wave controllers), so if you have one of these and are interested in trying it please let me know.
